Microsoft's cloud service, Azure, provides a plethora of services to choose from when it comes to running your solutions on the cloud.
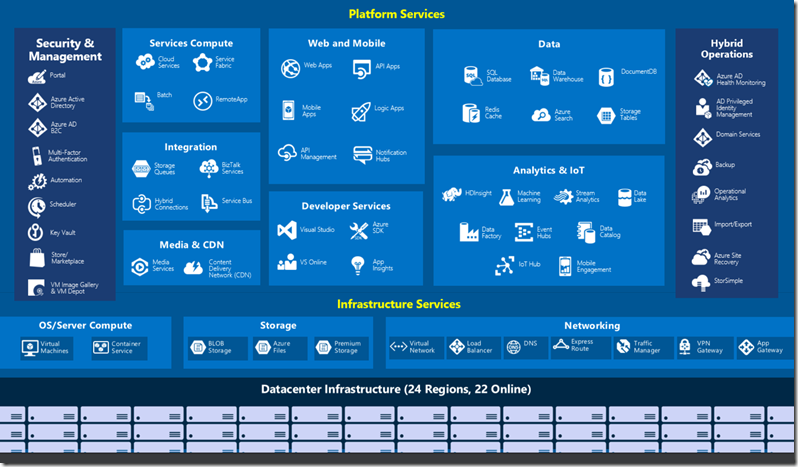
By now, most of us are aware of the PaaS, IaaS and SaaS variances. The image below provides a good summary, in case you're new to this.
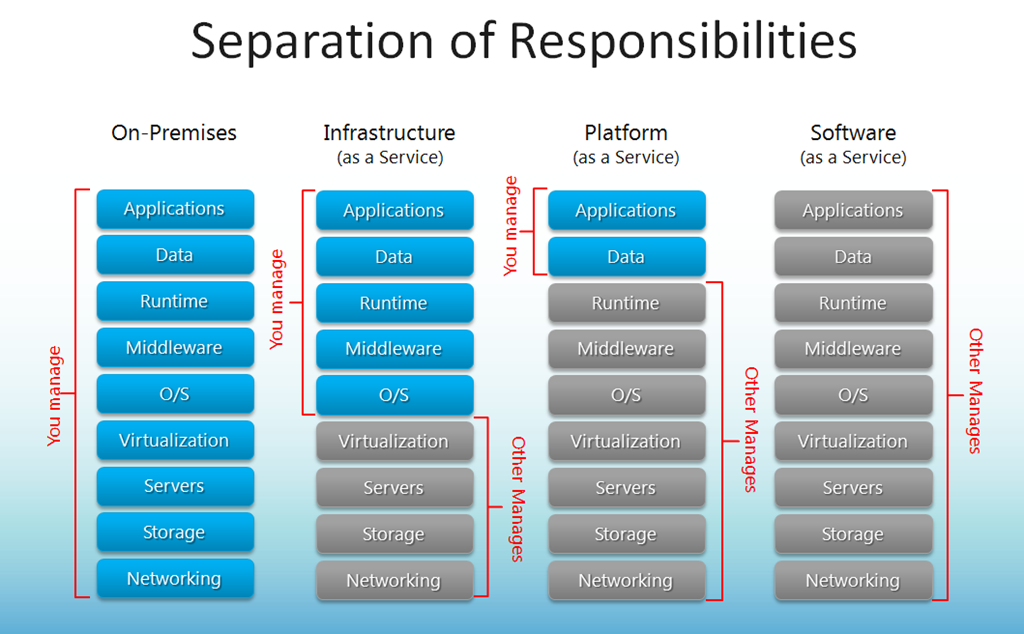
The trick with the cloud is how to choose the right service or combination of services to make your solution as flexible, scalable and performant as possible while cutting down on costs. However, if there's one thing you need to be careful about is that you should avoid the "lift and shift" mentality as much as possible (more on this at a later blog post) otherwise the move to the cloud could turn out to be more expensive than running on premises.
With the explosion of services comes an equally increased need for monitoring. Monitoring is vital for ensuring the smooth operation of any <cloud-based> infrastructure, whether it's Office365 (SaaS), a bunch of VMs (IaaS) or a set of applications and web apps (PaaS). You need to be aware of the health of your infastructure, the uptime of your applications, any potentical performance bottlenecks and, last but not least, you need to be on top of all security threats. However, to meet this requirements, you have to use a combination of tools. The problem is that with the list of monitoring services available Azure or not, choosing the right tool can be hard and sometimes confusing. In this post I'll try to explain the 3 most important monitoring services that are part of Azure and can help you meet your monitoring requirements.
Important: although this post is focused on the 3 Azure-based monitoring services, there's nothing stopping you from using a 3rd party monitoring service or even deploying your own custom monitoring stack (for example ELK) to achieve the similar results.
Application Insights
When it comes to monitoring your applications, [Application Insights](https://docs.microsoft.com/en-us/azure/application-insights/app-insights-overview" target="_blank) is the tool for the job. Application Insights (as the name implies) is designed to monitor PaaS solutions but it's not limited there. In fact, a little known fact is that AppInsights can be used by any application, hosted on any platform (on premises or the cloud) and it's not limited to the Microsoft stack. The OSS SDKs allow you to implement and collect telemetry from a vast variety of applications (Node.js, JavaScript, Python, Ruby, .NET, Java etc). The SDKs collect telemetry automatically but you can easily extend the types of data collected by instantiating and using a TelemetryClient. This way, you can inject custom telemetry such as events, metrics etc.
To take it a step further, AppInsights integrates easily with existing logging frameworks such as Log4Net, Log4J, Serilog etc for an integrated logging solution. This means that you don't have to strip out any custom logging you may already have on existing application but instead, enhance your logging capabilities with further integration.
All collected data ends up on Azure and there's a good reason for this! Apart from the awesome dashboard pic below
that provides you with real-time analytics, errors and performance counters
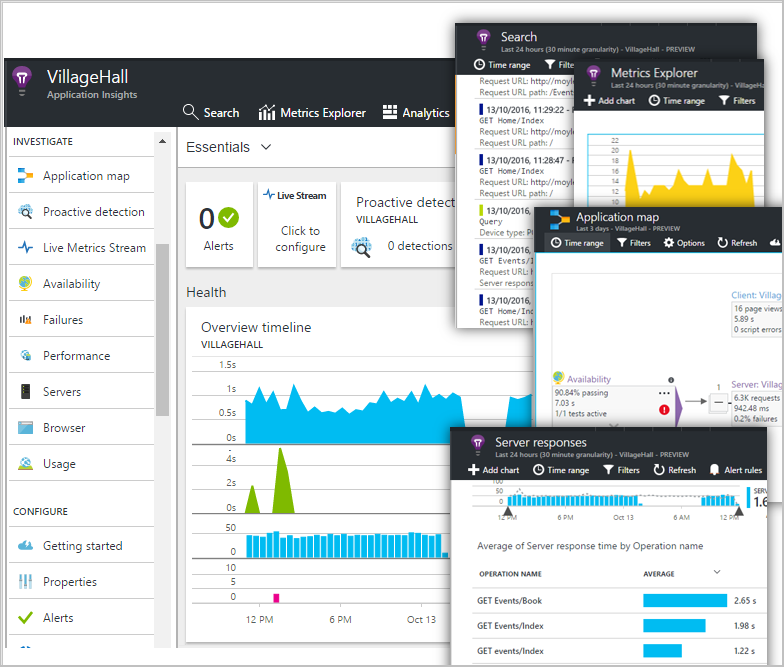
you get Machine Learning and a powerful analytics engine. Machine Learning is used to analyse your logs and provide you with suggestions to optimise your platform. The analytics can be used to create custom queries that go way beyond the experience offered straight out of the box and you can take advantage of correlation IDs to track the full lifecycle of a user interaction with your system, if this interaction spans multiple applications or apis (web app -> function -> logicapp -> web app).
Finally, it's important to understand that AppInsights is an invaluable tool for DevOps as well with direct integration to tools such as VSTS and GitHub. This means that you can go from locating a bug in the logs to creating a bug item/issue in your tool of choice in zero time (one click submit). To get started with AppInsights in your application you can install the SDK and provide the appropriate instrumentation keys to start collecting application telemetry. Alternatively, if your solution is already deployed on the Azure AppService, you can enable AppInsights from the applications settings without the need to reconfigure or redeploy your code.
Operations Management Suite
[OMS](https://www.microsoft.com/en-us/cloud-platform/operations-management-suite" target="_blank) sits at the highest level on Azure in terms of monitoring. It's the all seeing, all reporting eye, the ONE dashboard to rule them all. OMS is primarily used to manage your infrastructure, ie your VMs but it's so much more than that. OMS is the accumulation of a number of services and operations previously run as separate products, like the Active Directory Health service (RAP) along with Azure Monitor and Application Insights all wrapped in one. OMS like AppInsights can monitor resources regardless of the target platform. It doesn't matter if your solution runs on Azure, AWS, Google Cloud or on premises (or a combination of all of the above). You can use this single product to manage your whole infrastructure from one central location.
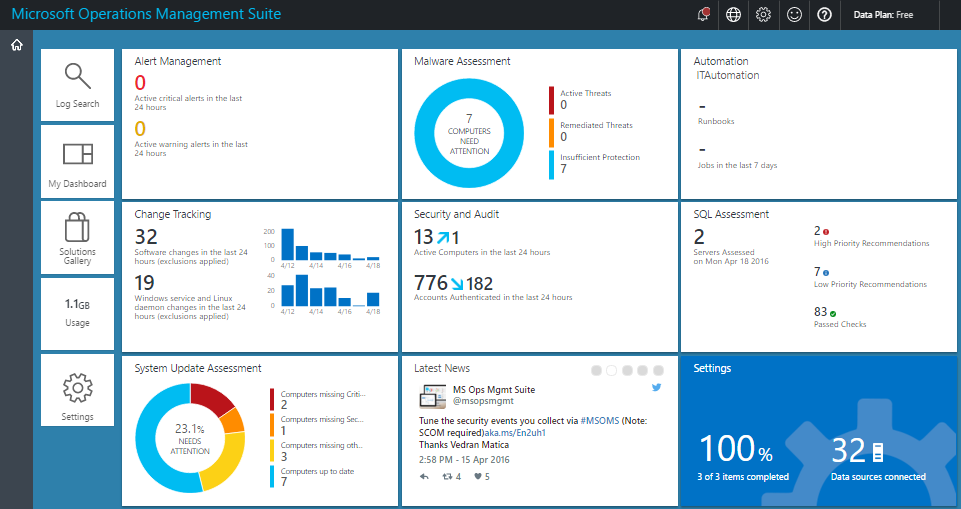
OMS is critical for providing targeted and focused information on the health of your infrastructure, critical action points and failures. Similarly to AppInsights, it comes with a very powerful analytics engine that allow you to query across every log ever collected. This means that you can audit your logs for security breaches or inconsistent behaviour, audit for Key Vault access and DSC changes. AppInsights and Azure Monitor can also feed high level data to OMS to allow operations teams to have a quick check on the health of all monitored applications. OMS can integrate with both Windows and Linux systems and with other monitoring tools already in place to enhance the capabilities of your IT operations team. Finally, OMS has a large number of add-ins to extend the capabilities of the service and also to allow you to create truly tailored dashboards that only collect the necessary telemetry. There is, after all, a cost associated with the service so it's only reasonable to only pay for what you use.
Azure Monitor
This is one of the latest service to hit general availability (GA) and is designed to bridge the gap between AppInsights and OMS but with a twist. Apart from monitoring the health of your infrastructure and availability, you now have the ability to monitor Azure activity and diagnostic logs and create on automation tasks as a response to a specific rule. [Azure Monitor](https://docs.microsoft.com/en-us/azure/monitoring-and-diagnostics/monitoring-overview" target="_blank) comes with easily configurable alerting methods such as email, webhooks etc.
Where AppInsights manages your code and OMS looks after your infrastructure, there are services that don't fit either tool. Things like Notification Hubs, Service Bus, Storage etc can't be directly monitored. But we know that each service generates a number of logs when users operate on them (activity logs) or there is an issue (diagnostic logs). These logs can include configuration changes, scaling up or down commands, adding/removing members or failed requests and performance issues. Although these logs are always been collected, monitoring and reporting on hasn't been as easy. The Azure Monitor service has added this capability, giving you the tools to enhance regulatory compliance (where necessary) and increase the security and stability on the operations carried out on your infrastructure. Azure Monitor brings visibility to what happens on your infrastructure so that you can implement the right policies to safeguard the smooth operation of your business.
AppInsights vs Azure Monitor vs OMS
If youe're still confused and unsure when to use which, hopefully the quick summary below can help you out:
-
Application Insights : offers rich detection and diagnostics for issues at the application layer of your service. This is about YOUR code and how well it runs. AppInsights is well-integrated on top of data from Azure Monitoring but can also be used to track desktop and web applications deployed anywhere! You can push custom data from other services to it.
-
Azure Monitor : Offers visualization, query, routing, alerting, autoscale, and automation on data both from the Azure infrastructure (Activity Log) and each individual Azure resource (Diagnostic Logs). It was previously known as "Azure Insights" to confuse matters more :)
-
Operations Management Suite : "The one dashboard to rule them all", OMS can be used to monitor and manage infrastructure on Azure, on-premises and third-party cloud-based infrastructure (AWS and Google Cloud). Azure Monitor and Application Insights data can be routed directly to Log Analytics so you can see metrics and logs for your entire environment in one place.
Summary
Most companies will have a mixture of PaaS, IaaS and SaaS which creates a unique challenge when it comes to monitoring. The goal is to be able to proactively fix things before your users and your business are affected by unexpected failures or slow performance. The 3 tools outlined above, when used effectively, can help you establish a plan to proactively catch and triage issues and on the unexpected event of a failure, to quickly identify and resolve the problem. While not the only solutions out there, I find that the tight integration with Azure services a massive benefit. What are your monitoring tools and how do you feel they can stack against Azure? Let me know in the comments below.