[Azure SQL](https://azure.microsoft.com/en-us/services/sql-database/?v=16.50" target="_blank) is one of the most valuable Platform as a Service (PaaS) offerings on Azure, second only to Web Apps. It's incredibly cost effective and fully featured. It supports a number of database versions and can be deployed in seconds. The other day I was looking to test something with EF Core and I needed a database to run queries against. I went to the Azure portal, I created a database with prepopulated data using the AdventureWorks (Datawarehouse Workload - DW) and I was ready to connect and run my queries in less than 2 minutes.
If you use Azure SQL then there are 2 things you need to remember:
- Make sure you add your IP or IP ranges to the firewall in order to be able to connect
- The SQL Profiler is not available
The second one can be a pain, especially when you need to identify what queries you're running and how long they take to execute. Fear not though, because I have not 1 but 2 ways to address this limitation.
Using SQL Azure DMVs to profile queries
So as I was trying to figure out how to capture my SQL queries , I stumbled across [this article](https://docs.microsoft.com/en-gb/azure/sql-database/sql-database-monitoring-with-dmvs" target="_blank) that describes how to do query profiling on Azure SQL using DMVs (dynamic management views).
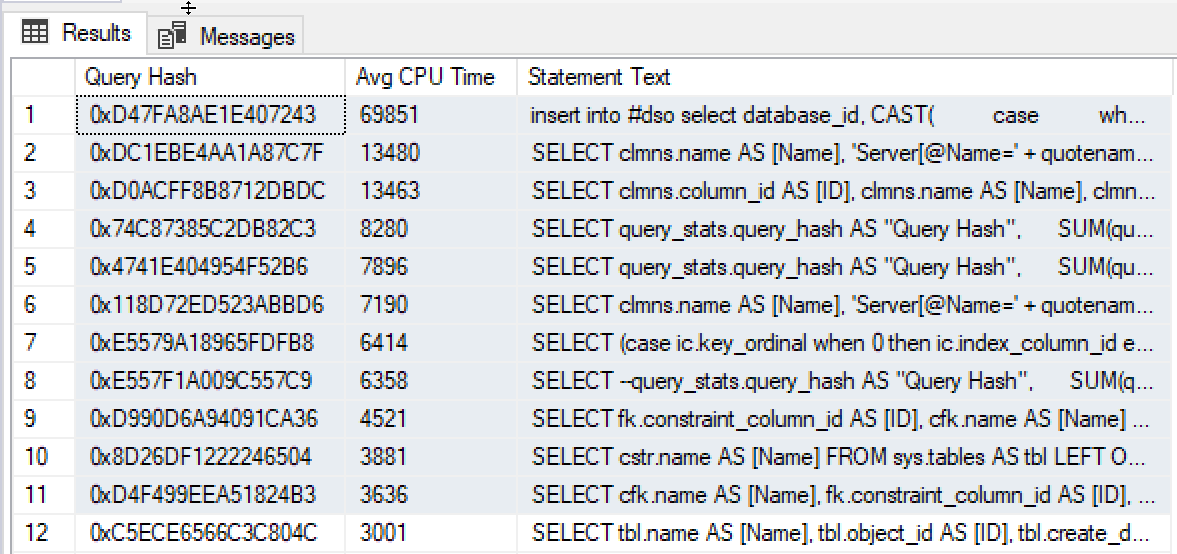
The query against the DMVs that identifies the queries that were run, grouped together and time averaged is attached below:
You can run the query in SQL Server Management Studio (SSMS), by connecting to your SQL Azure database instance and selecting the database you want to profile. The query output should look like this:
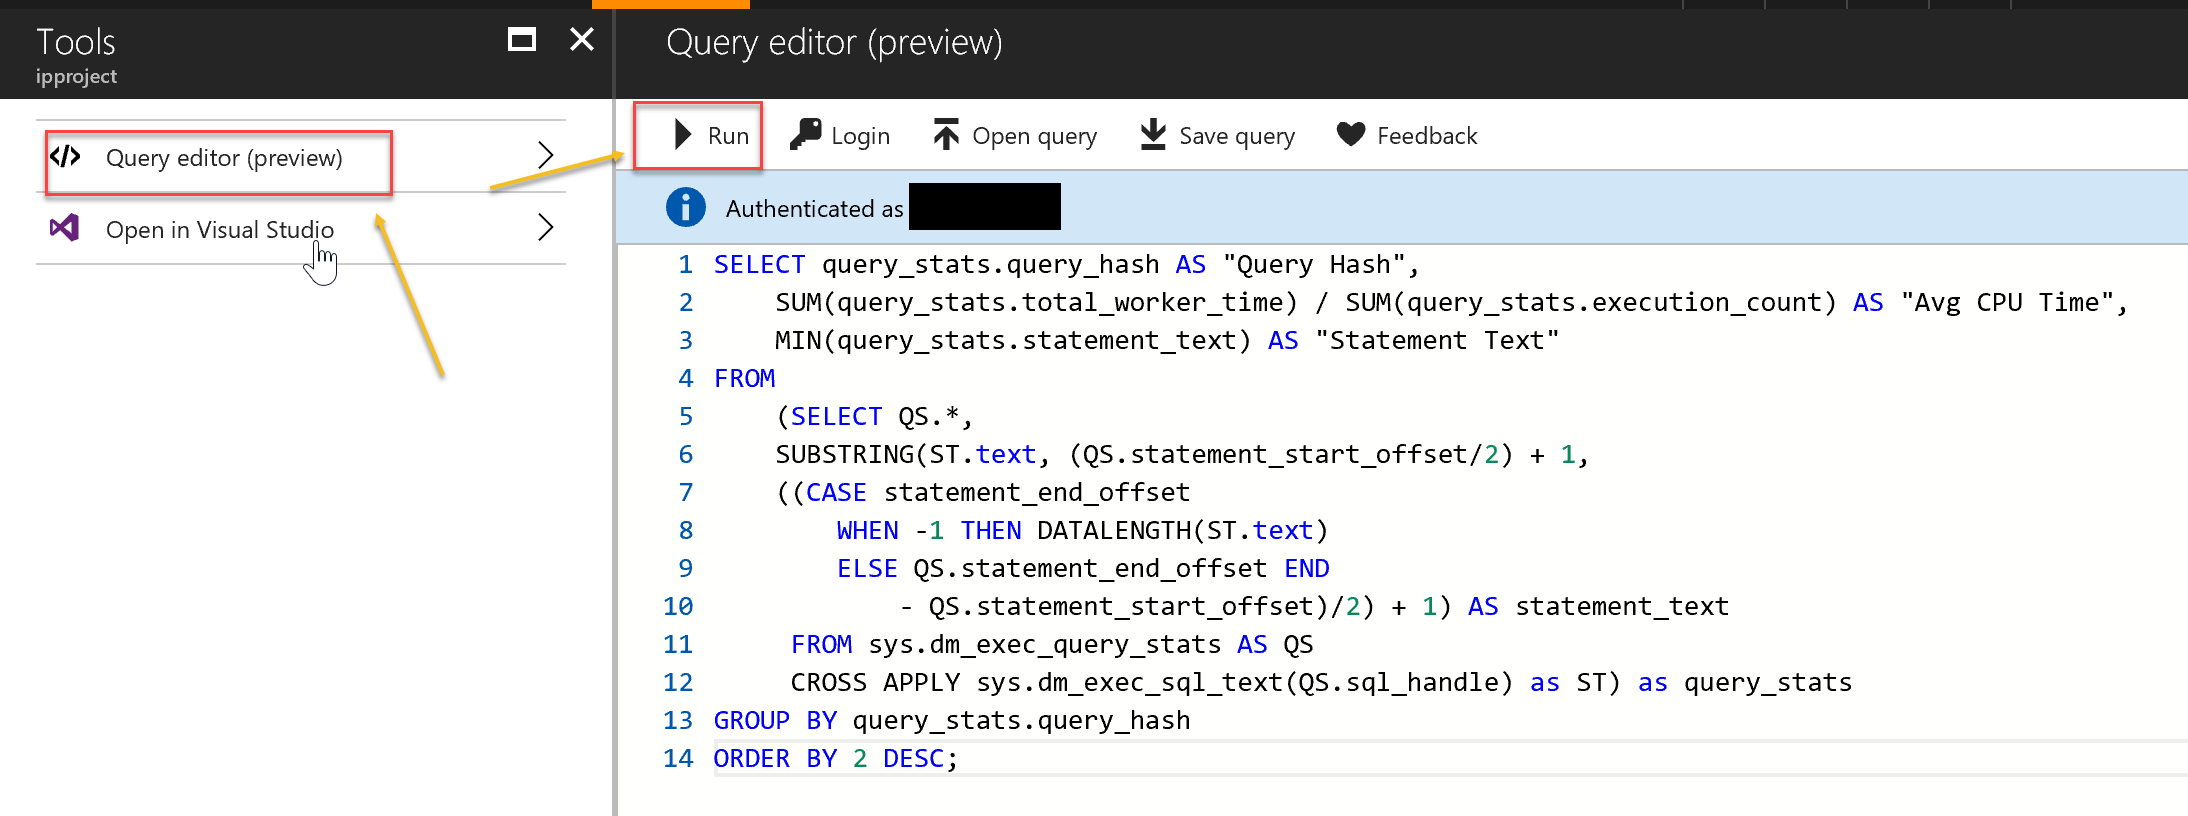
Alternatively, if you don't have an instance of SSMS installed locally, you can use the new Query Editor on in the Azure Portal. To find it navigate to your database -> Overview -> Tools -> Query Editor. You may need to sign up for the Preview.
Enable logging in Entity Framework (Core)
There's a caveat with this solution: it only applies if you're using EF 6 or EF Core. If you're using EF6, the solution is pretty straightforward and [I've blogged about it](GHOST_URL/logging-and-tracing-with-entity-framework-6/" target="_blank) before. You need to configure and apply a logger to the EF Context and it only takes 1 line of code.
In EF Core, things get a bit more complicated as you need to create a ILoggerProvider and inject it to the EF Context. Depending on the logging framework on your choice, you may be in lack and have an ILoggerProvider implementation out of the box. If not, the EF Core docs have a good explanation on the steps you need to take to configure this in your application. You can find the blog post here.
Which one should I choose?
The final choice is totally dependent on our needs. If you need to know the timings of your query, the DMV approach is better. If you simply want to find out what queries are executed in your code and you're using EF (Core) then you can leverage the local logging capabilities of the framework. In both case, there are some disadvantages as nothing is as good as running the SQL Profiler against the SQL database and capturing traces in real time. But at least there's a workaround.